
Map overview
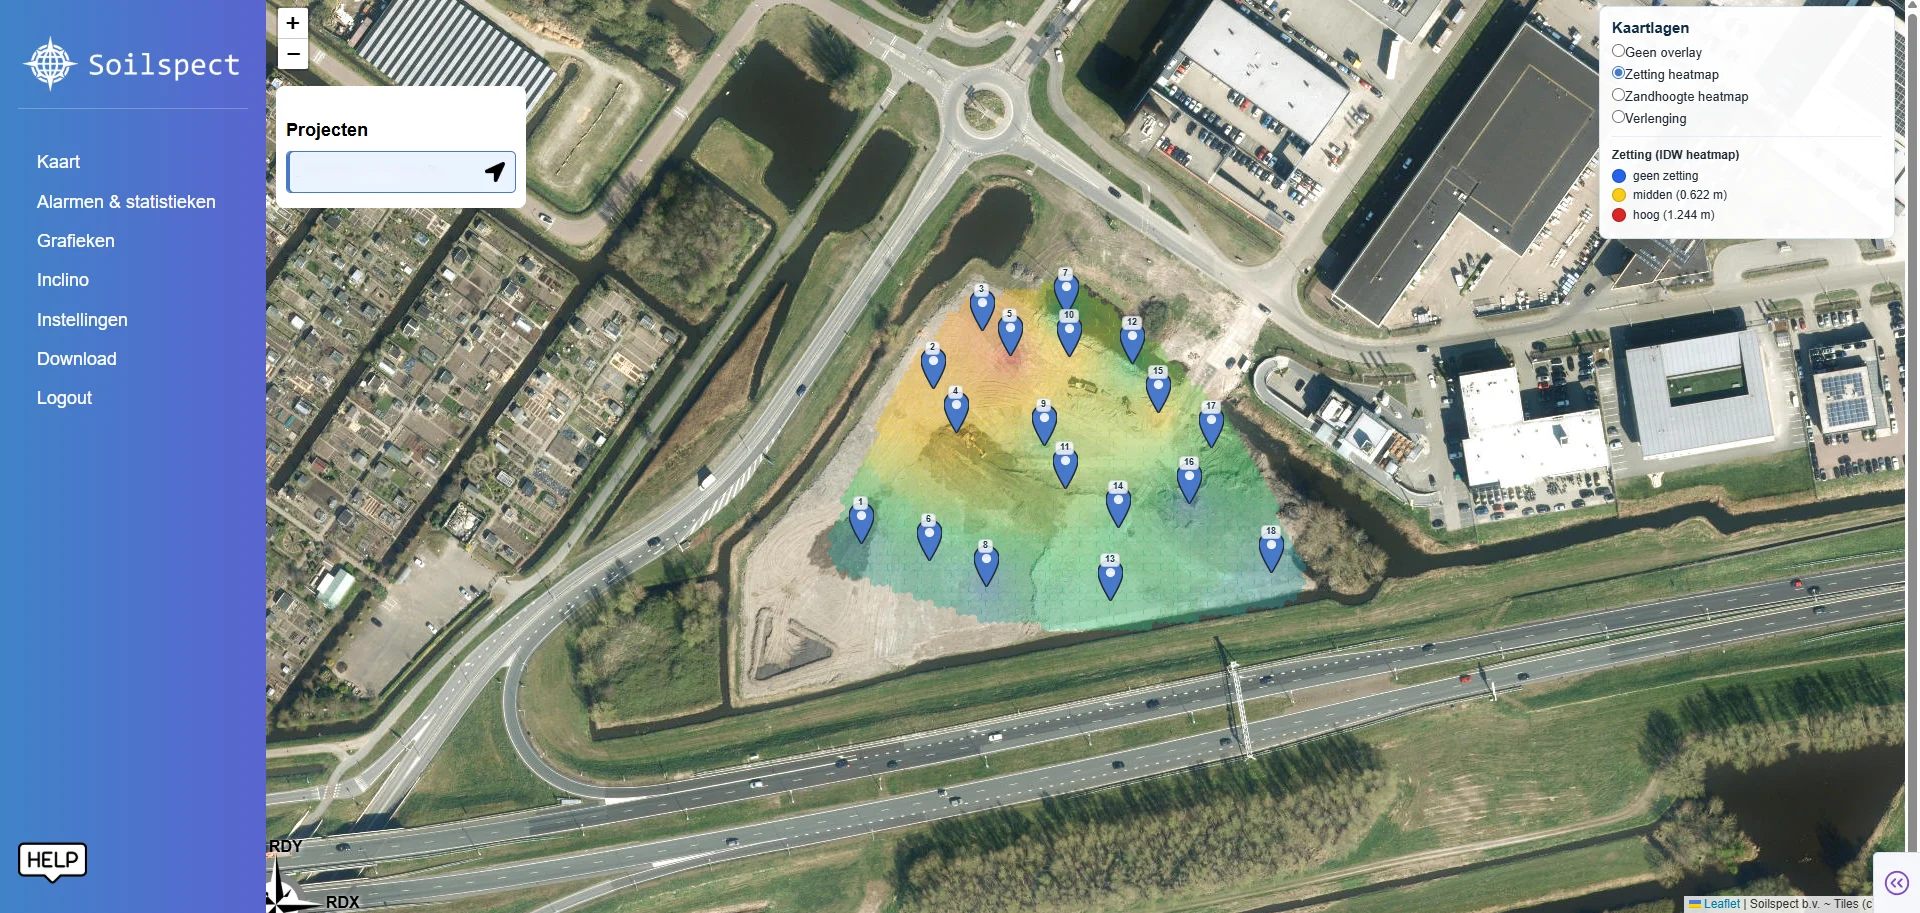
See where points are located and move straight to the relevant data.
Online platform
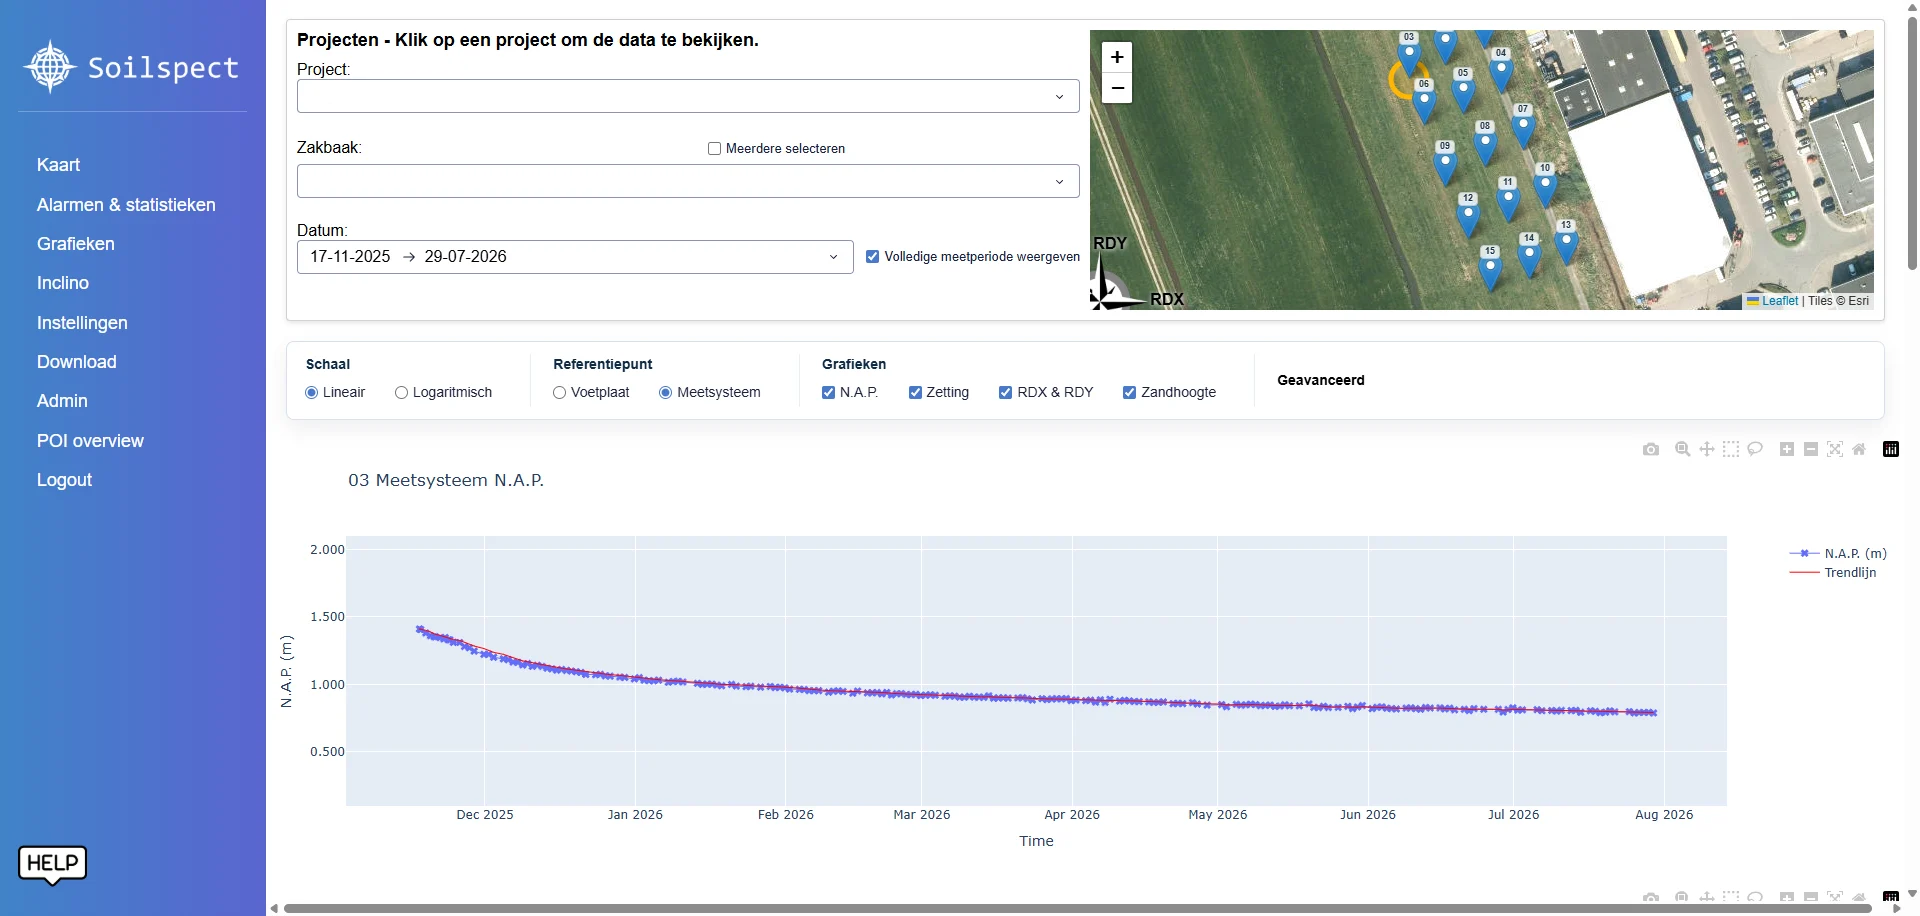
The platform shows locations, time series and trends for each project. Data can be exported for further analysis.
Features
See where points are located and move straight to the relevant data.
Follow trends over time and compare monitoring points within a project.
Keep projects, locations and time series organised in one place.
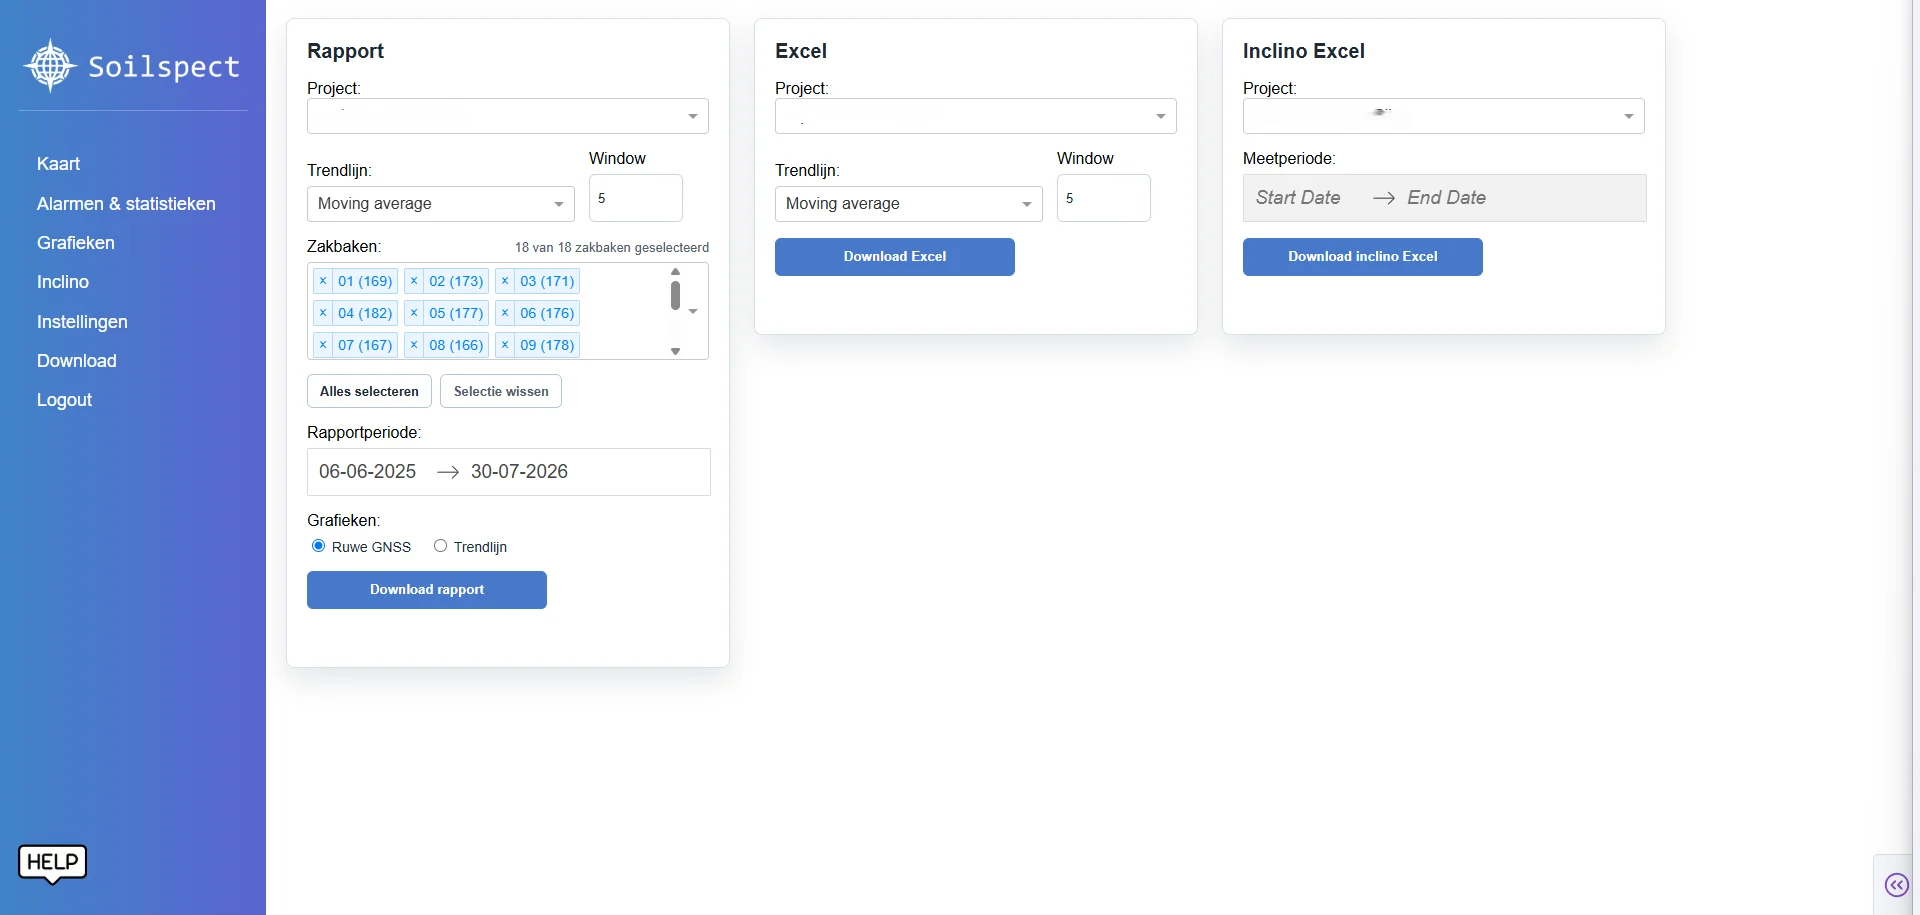
Export measurements for reporting or further analysis.
Project overview
Use the same measurements for progress reviews, analysis, reporting and handover.